GOM Tools for Shopify
Analytics and reports
Measure visits by channel and campaign, credit every sale to the ad that brought it and build your own reports.
The app measures your store’s visits with a Shopify pixel, only when the visitor gave analytics consent. With that you know which channel and campaign every visit, contact and sale comes from.
Turn on measurement#
- Go to Reports and click Turn on measurement.
- The app installs its pixel on your store. You don’t need to touch the theme.
- Check that your store shows the cookie banner: without consent, Shopify doesn’t load the pixel.
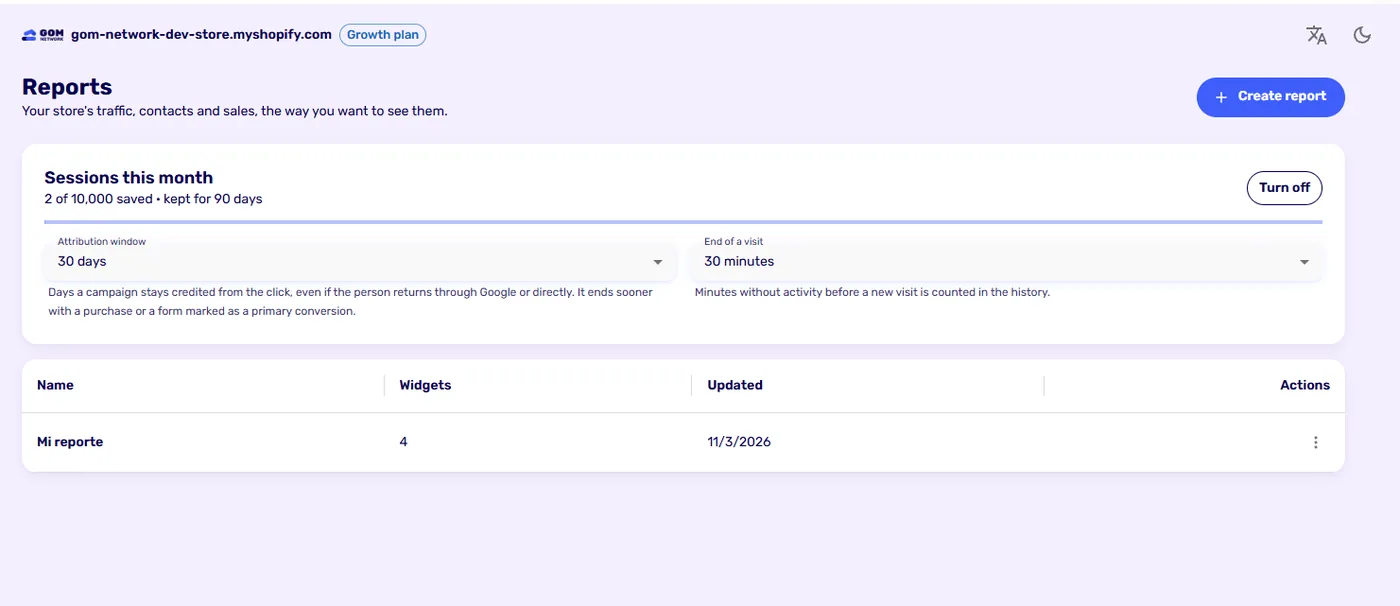
The card shows how many sessions you’ve used of your plan’s monthly quota and how long they’re kept.
Campaign attribution#
A campaign is an arrival with UTM parameters or an ad click ID (Google, Meta, Microsoft, TikTok and others). The app uses the last campaign click within the window:
- Someone arrives from an ad and comes back days later through Google or directly: the sale stays credited to the ad.
- They arrive from ad A and later from ad B: it’s credited to B.
- With no campaign in the window, it’s credited to how that visit arrived.
| Setting | What it is | Default |
|---|---|---|
| Attribution window | Days a campaign stays credited from the click. Visiting again doesn’t extend it. | 30 days (30, 60, 90 or 180) |
| End of a visit | Minutes without activity before a new visit is counted in the history. | 30 minutes |
A purchase closes the attribution: after buying, what follows is no longer credited to that campaign; only a new click opens another window. A form closes it only if you mark it as a primary conversion. A WhatsApp click doesn’t close it, because we don’t know whether there was a sale; a WhatsApp sale is reported by Business Manager.
Channels#
Each visit is classified into a channel type: paid, organic, social, AI assistants, referral, email, direct or other, and within it into a specific channel, such as Google paid or Instagram. To measure campaigns, group by Credited channel or Credited campaign, not by the visit’s channel.
Reports#
A report is a dashboard with the widgets you choose. Click Create report and then Add widget.
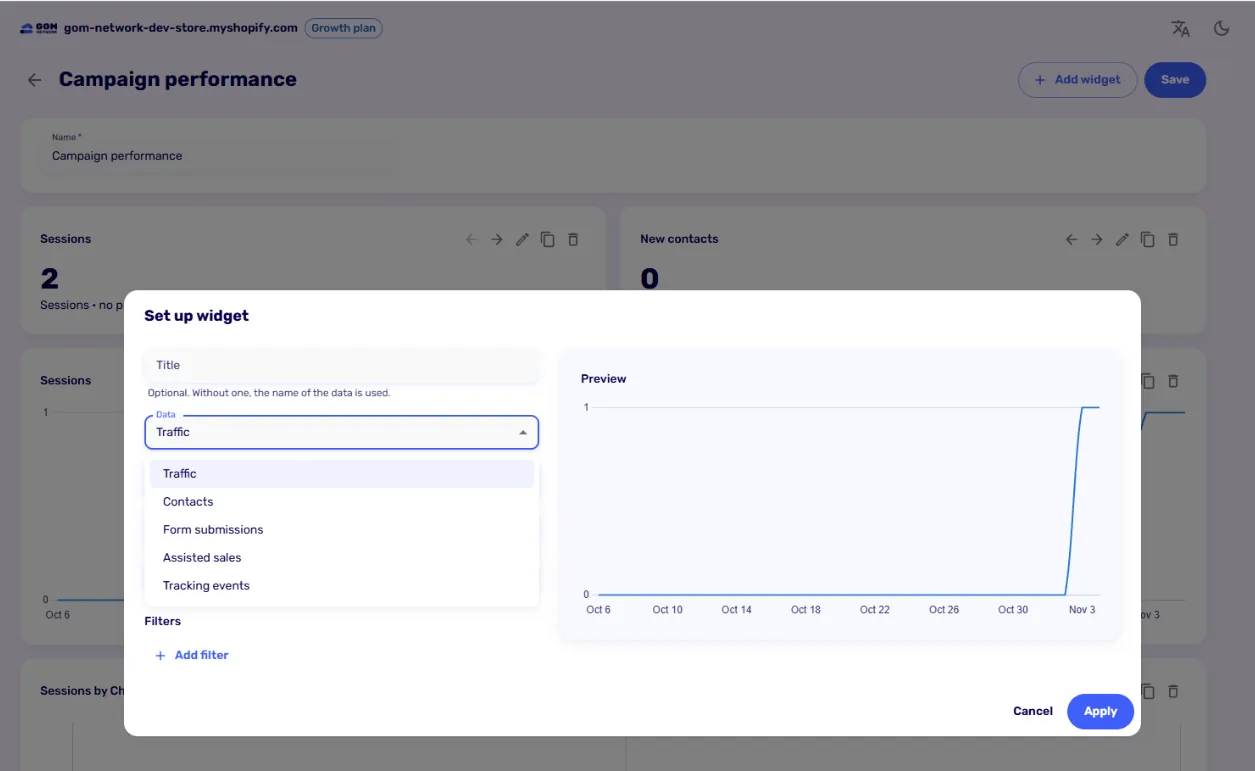
- Data: traffic, contacts, form submissions, assisted sales and tracking events.
- Group by: over time, channel type, channel, device, source, medium, campaign, landing page, referring site, or credited channel and campaign.
- Chart: number, line, bar, doughnut or table, with the period and width you want.
- Filters to keep one campaign, one channel or one form.
Assisted sales#
When a sale happens, the app saves what helped since the previous conversion: other channels and campaigns in the journey, a form or a WhatsApp click. The assisted sales report counts distinct sales; don’t add up their value across rows, because a sale appears once for each thing that helped.
Good to know#
- Sales are added up only in your store’s main currency. An order in another currency counts as an order, not as revenue.
- Dates are in UTC.
- Sessions are kept according to your plan, from 30 days to 13 months. Daily totals, with no personal data, are kept for 14 months on every plan.
- If the monthly session quota fills up, visits stop being saved; contacts and forms never do.
Visit reports are on every plan. Channel and campaign analytics, the contact history and assisted sales come with Growth.
Didn't find what you were looking for? Write to us at info@gomnetwork.com.